This post is a response to Palladium‘s recent article, How GDP Hides Industrial Decline (PDF snapshot), written by Patrick Fitzsimmons.
The Palladium article is a long diatribe against the methods used to calculate GDP and, specifically, the manufacturing component of GDP. On the merits, the article is disastrous. The author speaks authoritatively but confuses simple concepts; a host of vague, abstract complaints is presented with almost no empirical backing; data are often missing and, when provided, contradicts the claims made; the line of argumentation is tremendously confused; on the whole, it is a thorough embarrassment.
It is not just wrong in one particular way. Instead, the article is fractally wrong — on every level of examination, from the specific to the conceptual, it is a pure master class in how not to analyze a complex topic, reminiscent of how the output of early GPT iterations was grammatically correct but often semantically incoherent.
Table of Contents
Executive summary
- Patrick Fitzsimmons claims, in Palladium, to identify numerous problems with GDP calculation methods
- Fitzsimmons advances a number of confused and flawed arguments incorporating circular reasoning
- Specific examples presented as evidence often actually contradict Fitzsimmons’s narrative upon examination
- Numerical data are misrepresented and selectively presented to give a false impression of decline
- Fitzsimmons essentially doesn’t seem to believe in the concept of international trade
Inventing fictitious problems with real value-added output
The article begins with a fair amount of background information but eventually moves on to the first section with substantive critiques, namely “A Fictitious Measure of Output With No Meaning.” Put simply, it is not real value-added output that is fictitious but Fitzsimmons’s criticisms, which are only compelling in the most superficial sense.
Simply claiming that statistics are wrong does not constitute an argument
Consider the three examples given by Fitzsimmons of supposedly incoherent discrepancies between gross output and real value-added output:
What we see are bizarre results where “real value-added” is implausibly up even when the production of actual things, or the actual inflation-adjusted value of the things coming out of the factory, is flat or down:
- Motor vehicles, bodies and trailers, and parts: actual light vehicles produced down 11%, real gross output of vehicles up 39%, real value-added up 125%. Inputs as a percent of gross output rose from 74% to 77%.
- Semiconductors: actual computer CPUs shipped is up 94%, gross output of semiconductors up 262%, real value-added up 1698%. Inputs as a percent of gross output fell from 52% to 25%.
- Steel mills & manufacturing from purchased steel: in raw tonnage, steel shipped is down 18%, real gross output is up 5%, real value-added is up 125%. Inputs as a percentage of gross output rose from 73% to 74%.
First, notice that there is no actual argument being made here; instead, Fitzsimmons is simply quoting industry-level statistics and claiming that they are “bizarre” or “implausible.” In general, if someone quotes a series of economic statistics from the same bureau and claims that they are inconsistent, what is the most likely explanation: that they are in fact inconsistent in some novel way, or that the speaker is simply mistaken? Of course, that is hardly a dispositive argument, but neither is Fitzsimmons’s passage above!
If we examine the actual statistics in question, they do not in fact appear to be especially discrepant. In the case of automobiles, a Tesla and a 1995 Toyota Camry require somewhat similar amounts of metal (for simplicity, let’s set aside the internal computer), but most would agree that the former product is far more sophisticated than the latter. Hypothetically, if you went from manufacturing only 1995 Camrys to only Teslas with the same input, it seems entirely possible that you could have an 11% decline in number of units produced yet plausibly claim that real value-added output has increased by 125%, because Teslas are obviously vastly superior to 1995 Camrys. Similarly, Moore’s Law famously observes that the number of transistors on an integrated circuit doubles every two years; is it so implausible that over a period of multiple years, value-added output for semiconductors has enormously outpaced growth in the number of actual CPUs produced?
(Interestingly, this present discussion touches on many points which we will revisit throughout the remainder of the article, such as whether or not it is meaningful to account for improvements in product quality as opposed to simply tabulating the number of units shipped, or the mathematical difference between a change in gross output versus a change in real value-added output.)
Scrap metal is already distinguished from raw iron ore as an input
In the final example, Fitzsimmons claims that the increase in real value-added steel output is so implausible as to be completely indefensible, and hypothesizes that an unaccounted-for input substitution resulted in this erroneous figure:
Actual steel rolling out of the mills is down, the inflation-adjusted value of the steel and steel products rolling out of the mills is flat, inputs as a percentage of output is the same as ever—yet value-added is up 125%!
I challenge anyone who believes in these statistics to tell me what in the real world happened so that raw tonnage of steel was down, real gross output of steel was flat, usage of inputs was up, but “real value-added” was also up, and up hugely. Nobody can explain these numbers. The BEA cannot—I have asked them! If the raw data still exists, nobody has access to it because it was confidential.
[…]
My guess is that what happened with steel production is that factories have moved from using raw iron ore to scrap metal as an input. The scrap metal is actually closer to a final good and requires much less energy to turn into steel. But GDP calculations do not know that scrap metal is closer to a final good. What the GDP calculations see is that materials have become more expensive and that energy inputs are less, so it seems like the steel factories are maintaining output with much less input, and thus value-added is greater. The reality, though, is that the United States is not producing any more steel out of factories, the United States is not producing a greater percentage of the steel value chain than in 1997, and the 125% increase in real value-added is a spurious result that represents neither making more stuff nor making better stuff.
Let’s take a step back. Before we even consider the plausibility of the narrative that Fitzsimmons gives us about substitution from iron ore to scrap metal, we should note that is a purely fictitious narrative with no empirical evidence that could distinguish it from any other plausible narrative that fits the evidence. I could just as legitimately claim that automation or energy efficiency has decreased input costs and that the increase in nominal input cost as a proportion of output is actually a real decrease. Or, alternatively, I could claim that steel mills have shifted to manufacturing more AHSS/ULSAB grades or electrical steel, which have a higher unit value for the same tonnage. Alternatively, perhaps steel mills have bundled on auxiliary services like design assurances or galvanization which end up wrapped into final real value-added? Why not all of these together, as a matter of fact, considering that I’ve supplied as much empirical justification for them as Fitzsimmons has for his preferred hypothesis?
In fact, all of the hypotheses that I’ve supplied are more plausible than Fitzsimmons’s narrative, because, crucially, he misses that the BEA actually differentiates scrap metal as an input from raw iron ore. For example, the 2002 BEA Data Analysis for the Development of the Experimental PPI Aggregation System explicitly breaks out S00401 “Scrap” and S00402 “Used and secondhand goods” as separate commodities, and commodities are rows in the BLS Use Table, which is where scrap shows up as an intermediate input to steelmaking. It is in fact true that U.S. steelmaking has progressively shifted to using scrap rather than ore as an input due to a shift toward electric-arc furnaces (EAFs), but this is in fact consistent with an increase in real value-added, because EAFs use less energy per ton of output and a different input mix in general, plausibly leading to a significant reduction in real inputs. (Again, note that a change from the nominal input share from 73% to 74% could obscure more complex dynamics with real inputs varying significantly after adjustments with deflators.)
Is it actually true that EAF usage shifted input mixes to increase real value-added output, perhaps in combination with a shift in output composition toward higher value-added products? I personally don’t know; however, importantly, I am not making any claims about the invalidity of real value-added output figures on the basis of this hypothesized narrative. Fitzsimmons, on the other hand, does want to make such a claim, but fails to demonstrate why we should prefer his narrative over a host of other competing explanations and, furthermore, is so unfamiliar with the example that he offers up that upon close examination it appears to actually contradict the point he is attempting to make.
At the end of the day, Fitzsimmons’s position is essentially that real value-added output numerically differs too greatly from gross output, hence it’s self-evidently bogus. But that is in actual fact the entire point of having two separate metrics — because they measure different things — and once we move past the initial ‘shock-and-awe’ of considering whether 125% growth in real value-add for automobile manufacturing is reasonable, we see that his argumentation has little factual basis aside from simple appeals to emotion.
Misunderstanding the difference between higher value-added and higher output
In the same section, Fitzsimmons also criticizes “retroactive” adjustments made to adjust for inflation and quality changes. He illustrates this with a simple example, reproduced below. See if you can spot the logical errors:
Another “quirk” of real value-added is that inflation adjustments and quality adjustments get applied retroactively, which creates wild inflections from small changes. In simplified terms, let’s say that, in 1997, car sales were $100 billion, and were still $100 billion twenty years later in 2017, with no changes due to inflation or input costs. Input costs in both years were $75 billion, meaning $25 billion in value-added in both years. The only thing that changed, let’s say, was that the “quality” of cars got 10% higher thanks to software innovations like Apple CarPlay and design improvements like crumple zones for safety—neither of which add to recurring production input costs. So, let’s say, our economists would adjust the 2017 figure to be $110 billion in “real” terms and show a small 10% increase, right?
Instead, the way it works is that a recent “base year” is taken, in this case 2017, and the base year is never adjusted. So rather than adjusting from $100 billion to $110 billion, the “real” output of 1997 is retroactively adjusted to be lower, in this case $91 billion, to get the same 10% increase. But then, our value-added in 1997 has fallen to $16 billion, and the increase in “real value-added manufacturing” has jumped from 10% to around 50%! We have created a 50% increase in car manufacturing not by actually producing 50% more cars or “objectively” making cars 50% better, but just by playing around with statistics and definitions.
First, it should be intuitive that it shouldn’t really matter whether you perform a quality adjustment to the base year or to the current year, for the same reason that when we talk about the prices of groceries over time, it doesn’t matter if we use 2020 dollars or 1920 dollars as long as we make a consistent choice. From the outset, we have good reason to doubt the fundamental logic here.
Change in total output mechanically results in a change in value-added
Let’s take a closer look at the specific numerical example given by Fitzsimmons. In brief, a car manufacturer produces cars at two timepoints \(t_2 > t_1\). Suppose input costs are constant, \(I = 75\), and that there is no inflation, so that outputs are also at \(O = 100\). Hence the manufacturer is adding 25 units of value to the inputs.
Now suppose that there is a real quality improvement made to the outputs (e.g., car safety improvements). In the example given, quality improves by 10%, or a factor of \(k = 1\). How should we adjust the output figures to account for this? Fitzsimmons claims that we should make the adjustment to output at time \(t_2\), resulting in \(O_1 = O, O_2 = kO\), but that what is done instead is the adjustment at time \(t_1\), resulting in \(O_1 = O/k, O_2 = O\).
It should hopefully be obvious to the reader that in both cases, \(O_2/O_1 = k\), making it very unusual that Fitzsimmons would claim that “our economists [should] adjust the 2017 figure to be $110 billion in ‘real’ terms and show a small 10% increase, right?” In neither scenario is the increase in real output anything aside from 10% to begin with! This reveals the clever sleight-of-hand being made here, where Fitzsimmons semantically confuses change in real output with change in value-added output.
Specifically, Fitzsimmons claims that “the increase in ‘real value-added manufacturing’ has jumped from 10% to around 50%,” which is total nonsense. Let’s say that you make apple juice from apples, and an apple costs $99, and you sell the apple juice for $100. Now let’s say that you figure out how to magically make the apple juice tastier, so that you can charge $101 in the market. There is no contradiction between the assertion that your apple juice has increased 1% in quality (from $100 to $101), and that the amount of value you’ve added to the raw apples has increased by 100% (from $1 to $2). In fact, it is not mathematically possible for the percent increase in real value-added to be less than the percent increase in total output when the input cost is held constant!
The specific numerical critique is also odd because if you were to adjust output at time \(t_2\) instead as Fitzsimmons prefers, you would have output values of \(O_1 = 100\) and \(O_2 = 110\). In the first timepoint, you have $25 value added, and in the second timepoint, you have $35 value added, which is an increase of 40% to the amount of value added. In contrast, if you use the “base year” method where you set \(O_1 = 100/1.1 \approx 91\) and \(O_2 = 100\), then the value added is respectively $16$ and $25$, corresponding to a 56% increase. Both of these values are significantly over 10%, so it’s not even like the counterfactual that Fitzsimmons proposes would result in a calculated percent change in real value-added anywhere close to the percent change in real output.
Negative results for value-added are legitimate outputs of deflator adjustments
The final point Fitzsimmons makes in this section is that adjusting the base year can lead to a conclusion of negative value-added at time \(t_1\):
The effect becomes even more extreme as the quality adjustment gets higher and makes the original value-added shrink to zero or negative. If the quality adjustment is 32%, the value-added increase becomes 652%! And after that it goes infinite and then becomes undefined. Of course, there are further complications. If the inputs are quality-adjusted in the same way as the outputs, the effect might be less, but this probably won’t happen because the methodology is quite different. This is all to demonstrate that value-added is not a measure of how much stuff the United States makes. It is a number that produces wild results and thus should not be mixed into aggregate statistics.
There are several possible responses to the points raised here. The first, most general response is simply that from a mathematical standpoint it should not matter whether we adjust at time \(t_1\) or \(t_2\). There’s no particularly obvious reason why we would a priori prefer one choice over the other.
It’s true that in the limit as \(k \to\inf\), adjusting output at \(t_1\) results in value added at \(t_1\) going negative. For example, if the quality increase is 50%, then we adjust \(O_1 = 100/1.5 \approx 67\) which is certainly below the value of the inputs.
The key misunderstanding, however, is that adjusting at time \(t_1\) means that you’re calculating in terms of dollars at time \(t_2\), meaning the negative value-added is given in terms of future dollars rather than in past dollars! If you calculate in terms of future dollars, why would you expect to be able to take inputs, put them through an old manufacturing process, and necessarily add value, even if there was some time in the past during which the old manufacturing process did add value to the inputs?
Suppose that we can use $75 of metal to build a magical flying car with an internal cold fusion reactor, or alternatively we could use $75 of metal to build a 2000 Toyota Camry. Intuitively, there doesn’t seem like anything necessarily illegitimate about saying that making the latter choice would result in negative value added — it’s just a question of whether we want to calculate in terms of present dollars or past dollars.
Finally, the ‘problem’ of negative real value added is already well known in the economic literature. From Lai and Zhu (2022):
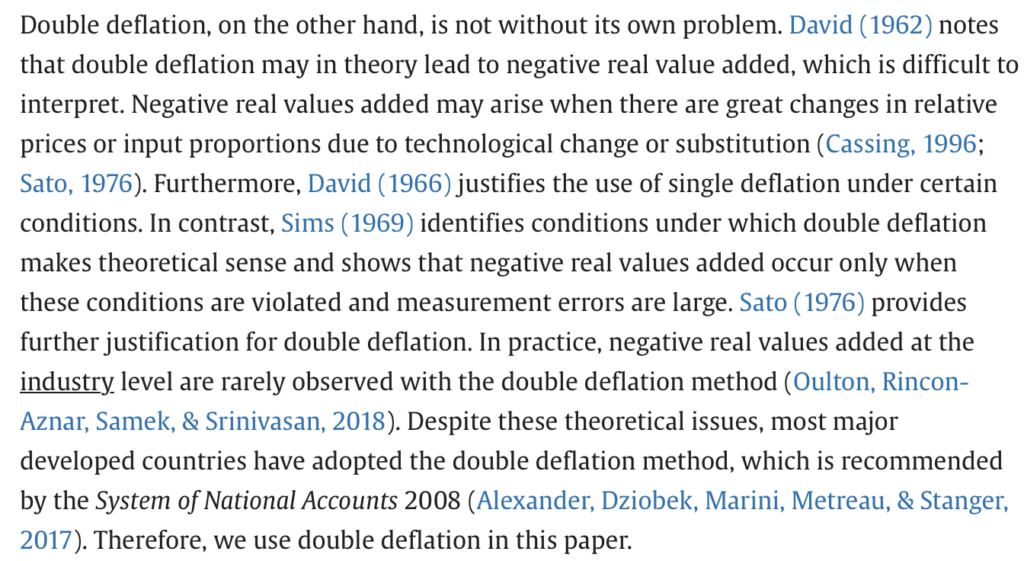
In the above, “double deflation” refers to the parallel adjustment of inputs and outputs, which can produce negative real value added in time series. This has been known since 1962, it appears to be a relatively rare issue, and double deflation is still the accepted standard calculation method for real value added. Also, regardless of whether or not the deflators used occasionally lead to negative real value added, we should still be able to look at the change in real value added over time. Recall that the original impetus for Fitzsimmons’s post was skepticism about the upward trajectory of value-added manufacturing over time; shifting a time series up or down does not have any bearing on whether it is increasing or decreasing.
There are certainly real criticisms to be made of the concept of real value-added output, whether in or out of manufacturing, and it is entirely legitimate for Fitzsimmons to point out challenges in interpreting its meaning. However, the particular example which he produces to support his claim is logically incoherent to the point where I find it unclear how he could write down the words that he did while consciously thinking about them, because if you understand how real value-added is computed, then it follows almost mechanically that a % change in total output will lead to a higher % change in value added.
On top of that, Fitzsimmons readily admits that this is a purely fictitious scenario:
I do not know if these scenarios described above are the actual reasons for why value-added is so greatly outpacing gross output. No one else knows either. The examples I just explained are just two of the many possible ways that value-added can give bizarre or counter-intuitive results.
Again, there are certainly a number of theoretical problems with the calculation of real value-added, and these have clearly been discussed in the economic literature for over half a century. However, at the end of the day, it’s not like value-added is an incoherent concept in and of itself, and it’s clear that over that half-century of debate, economists haven’t really come up with methods superior to double deflation of inputs and outputs. Instead of proposing an alternative, Fitzsimmons invents a contrived scenario to illustrate the “problems” with real value-added, misunderstands the computations in his own example, then brings up abstract critiques which have no necessary relation to the thesis of his article.
Inability to perform purchasing power parity adjustments
In the next section, “The Gloomy Reality of U.S. Manufacturing Output,” Fitzsimmons argues as follows:
- Some commentators use nominal, rather than real, manufacturing value-added to demonstrate that the U.S. is not lagging behind other countries.
- However, prices for equivalent goods vary between countries.
- Therefore, this argument is invalid.
There is nothing wrong with this argument per se. If an American car costs $20,000 and a Chinese car costs $10,000, and the two cars are functionally identical, then it would be correct to say that $1 million of American car manufacturing output is equivalent to merely $500,000 of Chinese car manufacturing output. However, the basic issue here is that Fitzsimmons fails to actually check his theoretical arguments against empirical data.
Fitzsimmons supplies a number of concrete examples; I will not reproduce all of them, but they are essentially captured in the following excerpt:
To the extent a country becomes so efficient at manufacturing some high-tech product that the price for it becomes very low, then that product actually counts for little in the nominal value-added numbers, even if the country is producing massive quantities of it. Which is more “output”—one million drones sold for a total of $2 billion dollars, versus one B2 stealth bomber for the same price? A $2,000 custom-made dress for the Met Gala, or one hundred pairs of denim work pants? Nominal value-added comparisons treat them as equivalent.
PPP adjustments do not make U.S. manufacturing appear significantly weaker
The most straightforward response is that this is the reason why the notion of purchasing power parity (PPP) exists. Let’s see how this affects the concrete claims made by Fitzsimmons. In the first sentence of this section, Fitzsimmons links an Econlog post which itself copied the following graphic from a Bloomberg article:
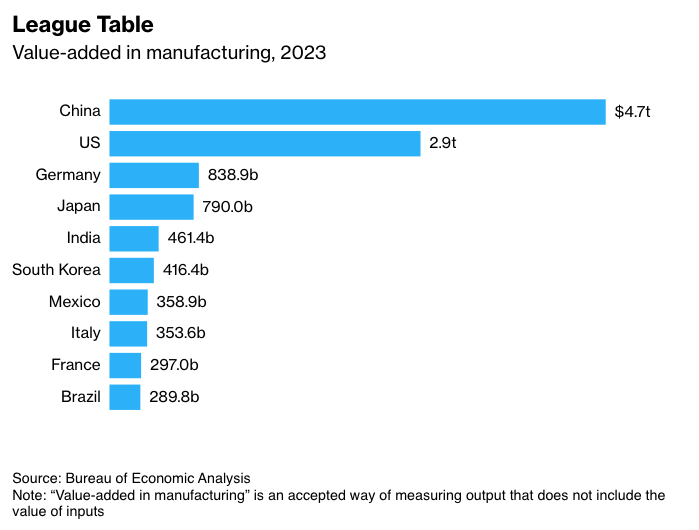
We can adjust these values using national-level PPP metrics:
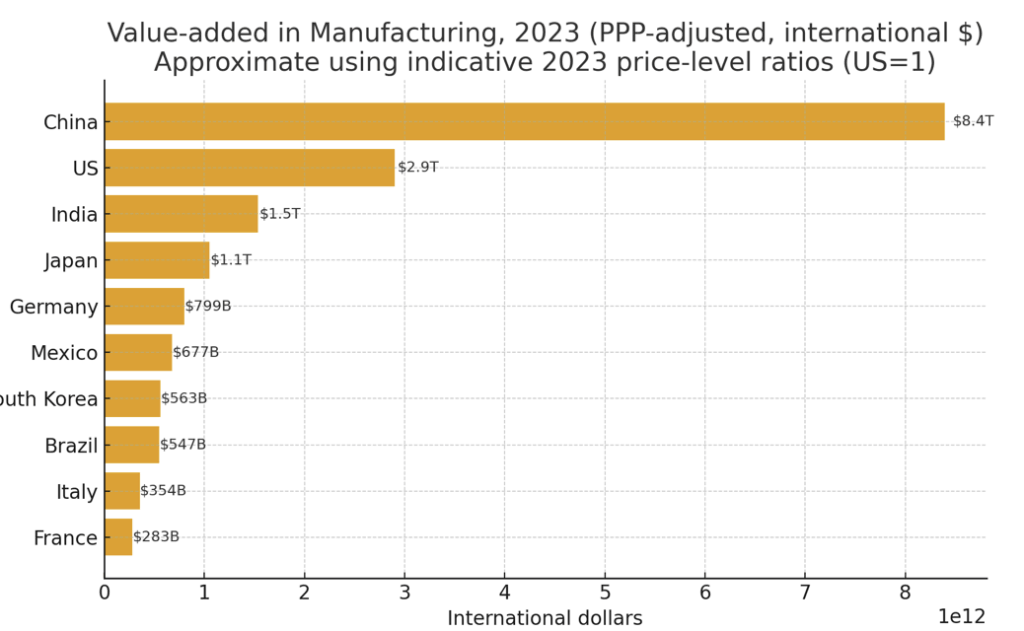
Adjusting for PPP enhances the relative ‘lead’ that China has on the U.S., but the U.S. is still clearly second-place on the list overall.
We can take this argument even further and calculate a population-adjusted (per capita) version:
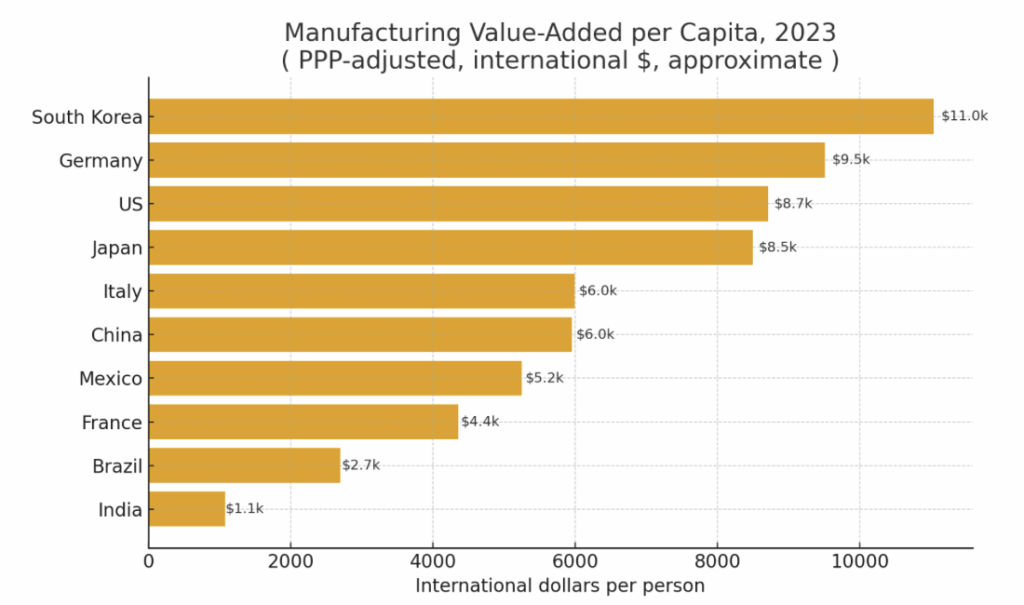
In this setting, the U.S. is rank #3, but not too far in absolute terms from #1, and China slips down quite far in the rankings! This is hardly surprising; China has nearly 5x the population of the U.S., so it’s fairly natural for the gross manufacturing output of China to be greater than that of the U.S.
Out of personal interest, I also plotted the per-capita adjustment made relative to the population share actually employed in manufacturing:
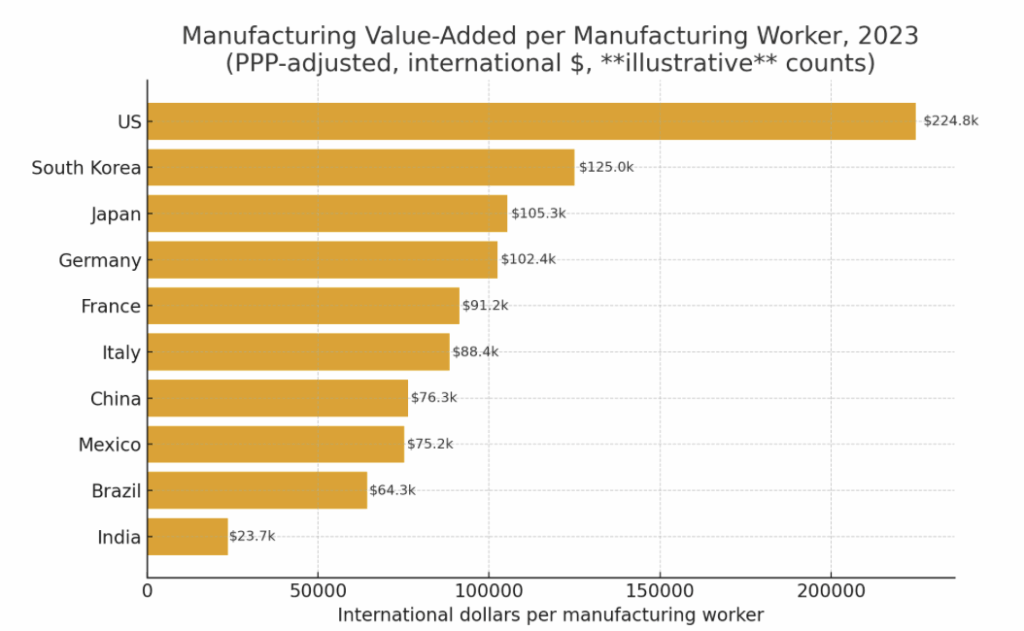
Here, the U.S. appears to lead. Again, this accords with basic economic intuitions; the U.S. is an advanced, service-dominated economy, so it should “benefit more” when we move from per-capita to per-manufacturing worker relative to other countries. Of course, perhaps one could argue that the U.S. should have a higher number of manufacturing workers and manufacturing output overall, but again, this isn’t really painting a picture of national decline.
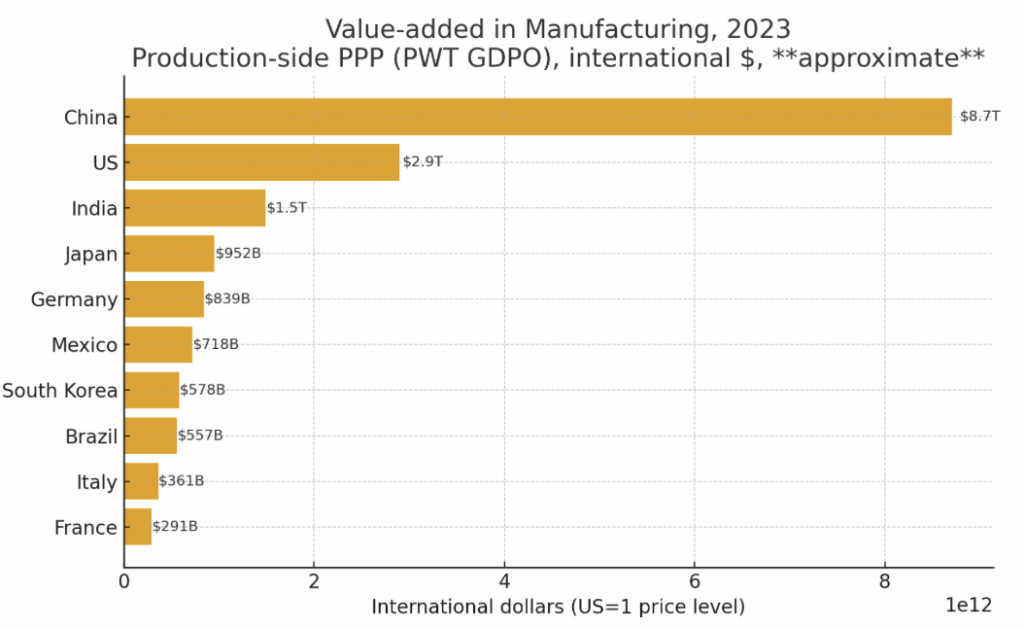
What if we believe that national-level PPP adjustments aren’t appropriate for comparing manufacturing outputs? We can instead use output-level (production) PPP adjustment via the Penn World Table, which gives a final result qualitatively similar to the original plot:
The purpose of this exercise is not to supply a definitive proof of U.S. manufacturing prowess but simply to demonstrate: first, that there are obvious and straightforward ways in which Fitzsimmons could have assessed the relevance of his theoretical complaints; second, that he clearly did not do them; and third, that when done, they do not provide evidence that the existence of differing price levels across countries obscures a decline in U.S. manufacturing.
One can argue that the PPP adjustments performed in the graphs I’ve generated do not capture the most important aspects of the data or otherwise somehow misrepresent prices for equivalent-quality manufacturing outputs across the world. The above is not meant to be dispositive, and I welcome disagreement; however, the critical point here is that Fitzsimmons does not supply any concrete evidence for his claims aside from a number of scattered anecdotes, and in fact failed to perform even the simplest, most obvious quantitative assessment of his claims. The mere existence of a theoretically valid complaint does not itself make that complaint valid; it has to actually be proven out through the data.
Misrepresenting the decline in per-capita manufacturing output
Later on in the same section, Fitzsimmons makes somewhat alarming claims about declines in per-capita manufacturing output:
Besides value-added, there are three other numbers sometimes used to track U.S. manufacturing output. Ultimately, these numbers are also inadequate, but to the extent they tell us anything, their story is more gloomy. The first statistic is the BEA’s Manufacturing real gross output data, the second is the BLS’s manufacturing real sectoral output index, and the third is the Federal Reserve’s index of industrial production for manufacturing.
When we look at these manufacturing output numbers, the glass half-full view is that “manufacturing output index is up from 1997-2023 and only 7% off its all-time high.” The pessimistic spin is that per-capita output is down 16% from 2007 and down 10% from 1997. It seems more reasonable to judge our standard of health as making stuff for the American population, and by that metric manufacturing has been getting worse for as long as this dataset goes back. For the Federal Reserve index, per-capita output is down 16% from 2007 and 2% from 1997.
The simple truth is that the numerical figures Fitzsimmons quotes do not seem to originate from the data sources he provided. First, none of the three sources he cited give per-capita data, so it’s unclear where he is paraphrasing from. Second, when I do look up per-capita data for manufacturing productivity, it does not support the claim made.
None of the three data sources contain per-capita data
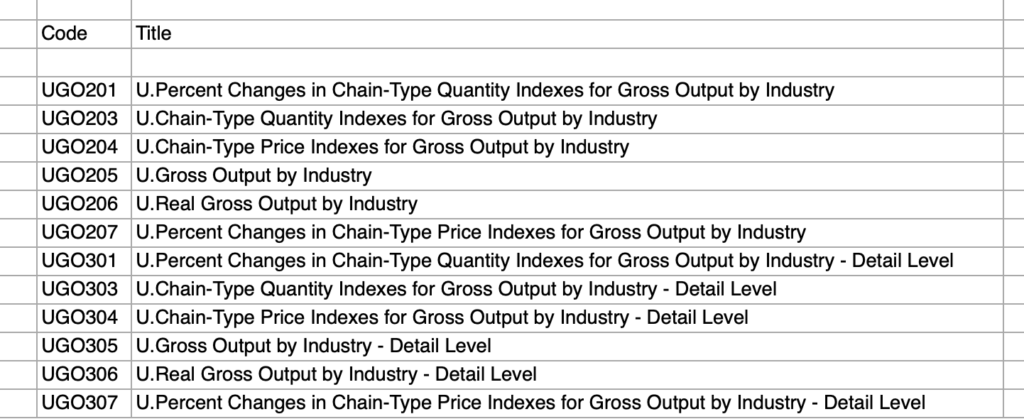
The first link is a direct download of an Excel spreadsheet. The first subsheet indicates that the file does not contain per-capita data:
The second link given is to the FRED time series Manufacturing Sector: Real Sectoral Output for All Workers (OUTMS):
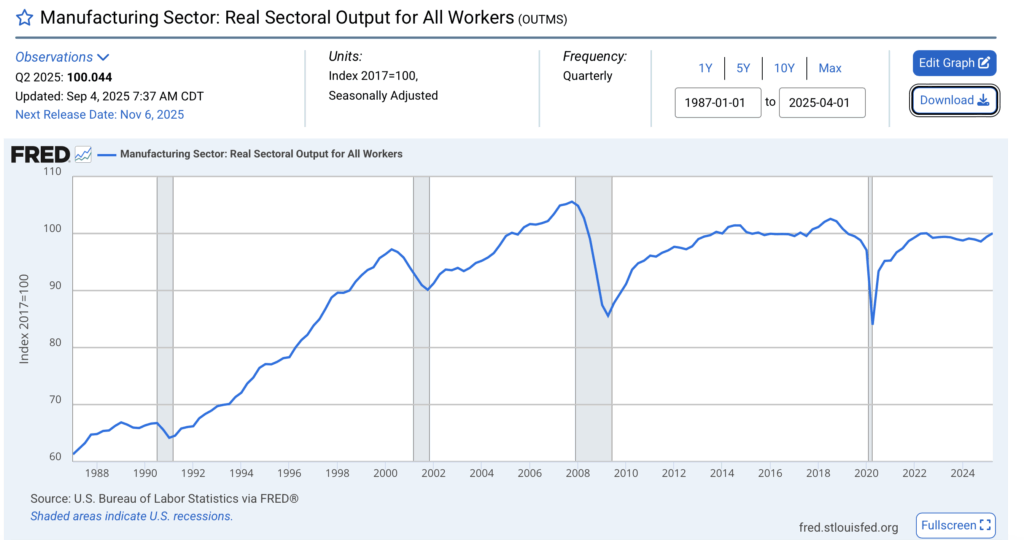
On top of not being a per-capita statistic, OUTMS is only 5% below its 2007 peak and significantly higher, not lower, than its value in 1997.
The third link is to the FRED time series Industrial Production: Manufacturing (NAICS) (IPMAN):
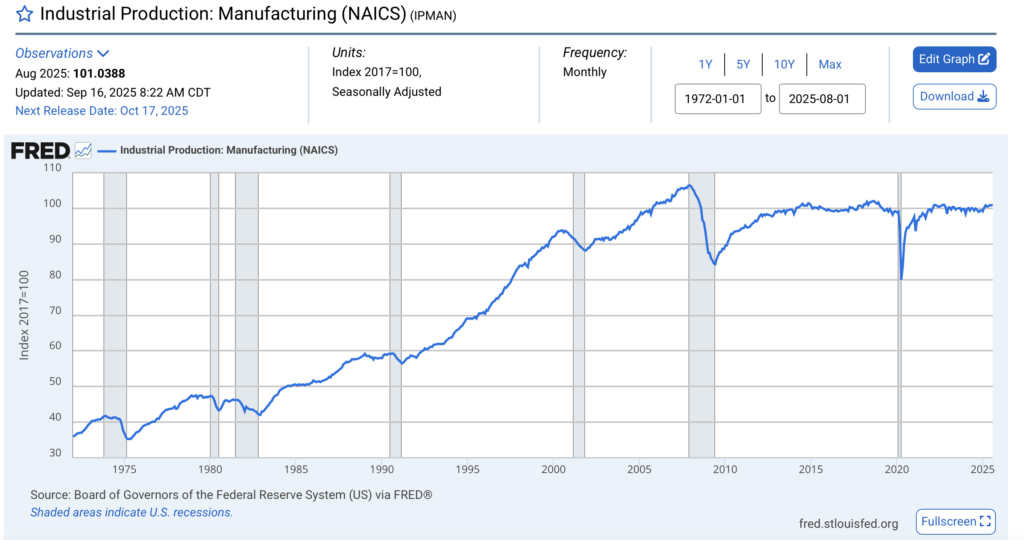
This is, again, not a per-capita time series. To his credit, he does accurately state that total manufacturing output is approximately 5% lower than its all-time high. However, recall that Fitzsimmons claimed that “per-capita output is down 16% from 2007 and down 10% from 1997.” Where are the data to support this?
Per-capita manufacturing output does not match the claimed trend
I cannot prove the nonexistence of a time series out there, somewhere, which supports the claim Fitzsimmons made about per-capita manufacturing productivity. However, on FRED, I was able to locate a data series titled Manufacturing Sector: Labor Productivity (Output per Hour) for All Workers (OPHMFG):
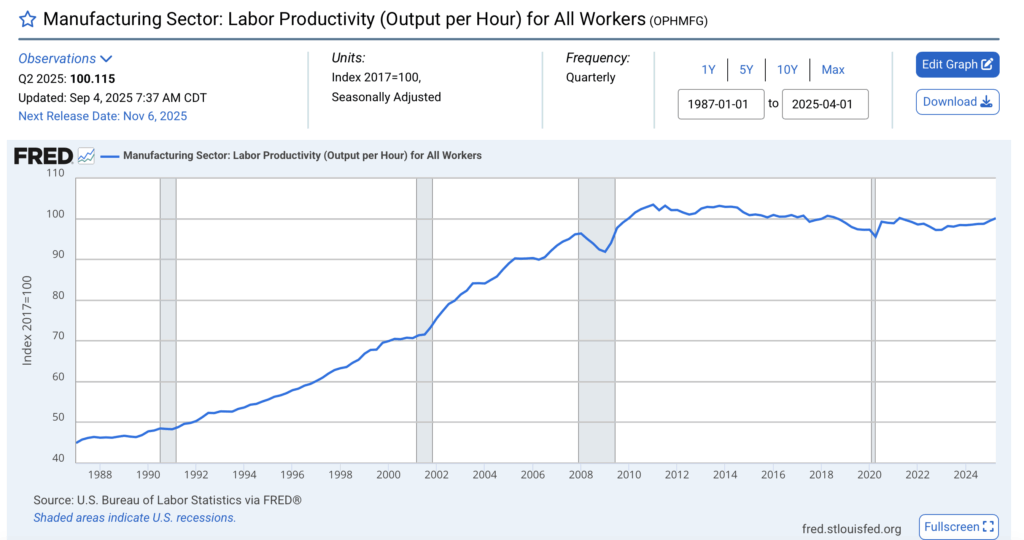
These data clearly contradict Fitzsimmons’s claim. Simply, output per worker is currently only slightly lower than it was at its peak and significantly (>60%) higher than it was in the year 1997. This is not surprising; we know that the percentage of the population employed in manufacturing has been almost monotonically declining since 1950, so it is natural that we see both total output and productivity per worker increasing over time. One possibility is that Fitzsimmons is referring to per-capita output in the sense of output per American citizen rather than output per American laborer, although (1) if so, then he should make this clear and supply the requisite data, and (2) it’s not clear why this metric would be more relevant or of greater importance than the OPHMFG time series.
Ultimately, I’m not terribly committed to this one particular measure of manufacturing labor productivity; the point is that Fitzsimmons made a specific numeric claim after linking three data sources, but none of the three sources were relevant to the claim made, and when you try to locate the correct time series, it is not consistent with his claim. At the very best, this is tremendously sloppy reporting.
Criticizing value-added output because it’s not gross, then criticizing gross output because it’s not value-added
Another interesting rhetorical trick utilized in this article essentially decomposes as follows:
- Real value-added output is a poor metric because it does not accurately capture changes in gross output.
- Gross output is a poor metric because, on account of not separating out the value-added component, necessarily includes the value of inputs.
When presented in close succession, it’s self-evident that this is not a serious line of argumentation — you can’t simultaneously argue that value-added is bad because it’s not gross, and then also argue that gross is bad because it’s not value-added!
Circular argumentation
Let us examine the broad contours of Fitzsimmons’s argument here, which is spread out across two sections, making this flaw not immediately obvious at first glance. First, he inveighs against real value-added output because it can “yield bizarre or counter-intuitive results,” a criticism which I addressed in a prior section. Following that, he confusingly devotes a considerable amount of effort into describing differences in purchasing power before arriving at “three other numbers sometimes used to track U.S. manufacturing output,” which are all essentially gross measures of output. However, note that Fitzsimmons continues on to argue:
But actually “down per-capita since 1997” is not the most pessimistic take—both gross output and the BLS manufacturing index have a crucial problem in that they do not subtract out components imported from abroad. When Dell sells a $5,000 server assembled in North Carolina with a Korean hard-drive, a Chinese motherboard, and a Taiwanese CPU, that server counts for $5,000 of American gross output. A car assembled in America with 60% foreign parts counts 100% for American output. Thus the actual hollowing-out of manufacturing may be even worse than these gross numbers suggest.
Notice that Fitzsimmons is supplying a perfect argument for taking into account the change in value accruing to the domestic manufacturing process, that is to say, the value-added output, which Fitzsimmons merely several paragraphs earlier characterized as “a fictitious measure […] with no meaning!”
One of the data sources already incorporates value-added adjustments
Even worse, however, is that Fitzsimmons misses that the Industrial Production: Manufacturing index, IPMAN, is constructed by aggregating data from different industries with value-added weights, so that industries with low value added contribute less to the total. From Industrial Production and Capacity Utilization – G.17:
Aggregation Methodology and Weights. The aggregation method for the IP index is a version of the Fisher-ideal index formula.[…] In the IP index, series that measure the output of an individual industry are combined using weights derived from their proportion in the total value-added output of all industries. The IP index, which extends back to 1919, is built as a chain-type index since 1972. The current formula for the growth in monthly IP (or any of the sub-aggregates) since 1972 is the geometric mean of the change in output (I), and, as can be seen below, is computed using the unit value added estimate for the current month (pm) and the estimate for previous month […]
We previously saw that the time series for OUTMS, which is the “BLS manufacturing index” referred to by Fitzsimmons and which does not perform any value-added adjustments, is qualitatively relatively similar to the time series for IPMAN. Thus, the data supplied by Fitzsimmons himself seem to directly contradict his claim of a “critical problem” being masked by using gross, rather than value-added, output.
It’s worth noting that IPMAN is not itself a measure of value-added output, so for a clearer look at this “critical problem,” we would naturally want to examine a direct measure of real value-added manufacturing. However, recall that this entire Palladium article is premised upon the time series of real value-added manufacturing being incorrect because its positive trend doesn’t match with the author’s intuitive impression of American industrial decline — we have essentially come full circle!
Misrepresenting the nature of quality adjustments in the PPI
Next, Fitzsimmons devotes an entire section, “The Fake Objectivity of Quality Adjustments,” to criticize what he perceives to be an arbitrary and fundamentally unjustified process of adjusting price and output indices based on changes in the quality of goods produced. A number of different arguments are advanced, principally:
- The lay population does not understand quality adjustments
- Positive quality improvements potentially ‘obscure’ negative changes in the number of units produced
- There are multiple equally plausible ways of performing quality adjustments, with a wide range of possible outputs, and the choice made is fundamentally arbitrary
- Post-hoc adjustments (or post-hoc changes in calculation methods) are intrinsically subjective and, hence, unreliable
We will examine each one in turn.
Public misunderstanding of a technical term is irrelevant
First, Fitzsimmons argues that including quality adjustments in headline numbers misleads the public:
While quality adjustments are often justified, they can mislead us in a number of ways. The first problem is honesty and clarity about what the data says. Economists and commentators usually refer to GDP as measuring “output.” Colloquially, output and quality are two different things. When we read a headline saying GDP data shows “car output has increased,” we think the U.S. has made more cars. We then apply our own views as to whether the quality of the car has changed. When we sneak quality into a measure but still call it “output,” we are double-counting and embedding the subjective in the objective, and we lose track of the hard numbers. We are not making more quantity of cars per person like the data says, we are making fewer cars, but with Bluetooth and crumple zones.
It is not immediately clear why misconceptions held by the public are relevant to the discussion at hand, in the same way that an economic analysis of tariffs is not contingent on whether or not the typical American understands that tariffs are a form of taxation.
Moreover, there are plenty of sectors where an increase in total output can plausibly be interpreted, even by a layman, as partially representing an increase in output; for example, if you were to say that pharmaceutical output has increased, it would be reasonable that some component of that increase accrues from producing more ibuprofen, acetaminophen, etc., and that some other component of that increase accrues from development of novel therapies. Claiming that “we are not making more quantity of cars per person like the data says” is peculiar, because that is not in fact what the data say; instead, that is what a mistaken interpretation of the notion of output would yield, which seems like a highly unusual basis for judging the factual accuracy of the data.
In any case, this first argument is not worth much consideration.
Self-contradictory positions on the basic legitimacy of quality adjustments
Second, Fitzsimmons seems to disagree with the fundamental validity of quality adjustments, writing:
Also, all three of these numbers are quality-adjusted. “Vehicle” output up 40% does not mean America produced 10 million cars in 1997 and 14 million today. “Semiconductors” up 260% does not mean we make four times as many CPUs. A 40% increase in output means that when you adjust for the changes in quality of today’s goods, we produce the equivalent in value of 14 million cars from 1997. Even if we actually produce 8 million vehicles, they are so much better, the “value” produced is much greater than that.
What, exactly, is wrong with claiming that the value of 8 million vehicles produced in 2025 exceeds the value of 14 million vehicles produced in 1997? Is Fitzsimmons rejecting the notion of quality differences in general, or that differences in quality and quantity can be continuously related through the price mechanism?
It is particularly interesting that Fitzsimmons would make this argument because, in a prior section, he appears to be a strong advocate for performing cross-country quality-price adjustments:
But, once again, the problem with the nominal value-added comparison is that it is not a comparison of actual things—it is a comparison of sales receipts. Thus a given quantity of products that is produced by a bloated cost structure will count as more “GDP” than the same number of products produced by an efficient factory. This is not just a theoretical problem—we know for a fact that the Chinese company BYD produces an equivalent to the Tesla Model 3 for half the price. Thus, $30,000 of manufacturing value-added in the U.S. might represent one car being produced, while for China it might represent two cars, and thus is actually double the output.
If we accept that different countries might produce equivalent goods that are sold at different price points, then we are necessarily accepting the idea that product quality is meaningful — otherwise there would be no meaning in talking about cars being “equivalent” and we may as well ignore the idea of purchasing power parity altogether. I would rather spend $30,000 on two BYD electric cars rather than on one Tesla if it’s true that one BYD car is equivalent to one Tesla, but if the BYD car is sufficiently ‘bad’ in comparison (e.g., if they tend to explode and kill the driver), then I prefer to have one Tesla rather than two BYD cars.
Looking back even further, we see that even more of Fitzsimmons’s prior arguments rely on the validity of quality adjustments. For example, the critique of real value-added is premised on the idea that total output and value-added output will change in differing proportions given an improvement in quality!
In some sense, it is actually somewhat challenging to respond to Fitzsimmons’s argument here because he almost seems to be disagreeing with the conceptual validity of quality differences in goods to begin with. This is simply not a coherent argument: even in any given snapshot of time, markets are still implicitly pricing in quality differentials, which is evident from the fact that different used cars tend to cost different amounts of money. In fact, if we eschew the concept of quality adjustments, we become unable to distinguish whether price changes reflect changes in the general price level or whether the underlying product has changed for the better or for worse, making it impossible to compute inflation over time.
Quality adjustments are transparent and openly debated, not black-box methods
Fitzsimmons then moves on to characterize quality adjustments as, essentially, both incomplete and opaque, starting with the example of quality adjustments for automobiles:
Worse, almost nobody understands what actually goes into the quality adjustments. For instance, you will hear the claim, “of course the price index for cars should be quality adjusted, because a modern car lasts longer than the clunkers of the 1970s.” And in fact, car longevity seems an obvious and objective place to make a quality adjustment—the agencies should adjust the price by the lifespan of the car. But the statistical agencies cannot actually measure how long a 2025 car is likely to last! Thus car longevity is not a quality adjustment that goes into GDP, for better or for worse.
If automakers move the location of a part so it does not burn out so quickly, that is not measured. If a new turbo engine is rife with problems causing early burnout, that is not measured. For automobiles, only quantifiable changes, such as the extra cost of adding a platinum-tipped spark plug, are included. While the BLS provides general information about the quality adjustment process, the specific methodology and the actual decisions are not documented.
Given that Fitzsimmons seems to have performed some rudimentary research into BLS methodology, it is moderately surprising that Quality Adjustment in the CPI: New Vehicles seems to have escaped his attention, as it directly and explicitly contradicts several of his claims (emphasis mine):
Criteria for quality adjustments
The CPI adjusts for structural and engineering quality changes such as:
- […]
- Changes in mechanical or electrical features that affect the overall operation or efficiency of the vehicle, or the ability of a component to perform its function, such as changes affecting steering, braking, stability, engine horsepower, traction control, transmission, battery life, and fuel systems and/or electrical systems.
- Changes in design or materials that affect the length of service, durability, need for repairs, or strength or performance of the item, such as stronger bumpers, HID headlamps, or flexible body panels.
Taking this document at face value, Fitzsimmons is simply incorrect that changes such as “[moving] the location of a part so that it does not burn out so quickly” are not included in quality adjustments. Nor does it seem necessary to have explicit foreknowledge of the lifespan of a new car; manufacturers make design changes based on certain considerations and therefore should be able to estimate the effect of those changes on overall automobile lifespan.
Furthermore, Fitzsimmons dislikes that “only quantifiable changes” are included in this method of quality adjustment (precisely, that a cost-based rather than hedonic method is used); however, this should actually lead to an underestimate of total quality improvements made, and directly cutting against Fitzsimmons’s claim that quality adjustments obscure changes in the quantity of units produced. Granted, it is true that the full calculation is not reproducible due to confidentiality agreements with manufacturers; however, this is a problem intrinsic to the mass collection of detailed pricing data. In this context, Fitzsimmons appears to be engaging in a ‘motte-and-bailey’ style of argumentation, where he first claims that “almost nobody understands what actually goes into the quality adjustments,” and then cleverly ends with a much weaker criticism of confidential methodology instead. (“Well, okay, maybe we do understand what goes into them, and maybe they do include parts longevity, but it’s not like we have every detail necessary to reconstruct the adjustments!”)
Next, Fitzsimmons moves on to discuss quality adjustments for microprocessors, a choice which is particularly ironic for reasons we will soon understand:
In most cases, there is not actually a single, objective way to measure quality changes. In fact, there are multiple plausible options for quality adjustments, which allows for the final statistic to be virtually any number, from flat-lining to off-the-charts. Consider CPUs. One option would be to adjust by raw instructions-per-second. Since that has increased one-thousand-fold since 1997, if this metric was used to measure quality, then improvements in semiconductors alone would mean U.S. total manufacturing output had increased by 500%!
On the other hand, the time it takes for an ordinary office worker to enter data into a spreadsheet and read the news has barely changed at all. So perhaps there should be no quality adjustment—one CPU is one CPU. In that case, with the computers quality adjustment removed, total manufacturing output for the U.S. would be down decisively per-capita.
Let’s set aside the fact that Fitzsimmons has switched away from his claim that “nobody understands” the internals of the quality adjustments — a claim that would be especially untrue for microprocessors given that the BLS has published a very detailed, 52-page report on exactly how quality adjustments for microprocessors are performed.
Implicitly, Fitzsimmons appears to be characterizing quality adjustments as essentially arbitrary, as though BLS economists choose relevant product characteristics at random. However, glancing at Quality Adjustment in the CPI, we see that this is patently untrue: the vast majority of goods have no quality adjustment whatsoever, and the remainder are mostly split between hedonic adjustments and cost based adjustments. From the outset, we see that the BLS is relatively conservative about making quality adjustments, and where they do so, they appear to choose from one of two dominant methodologies. (Further detail is given here should the reader wish to convince themselves that the methods used are reasonable.)
Stepping back a little bit, Fitzsimmons is complaining here that products are complex and have different characteristics, and so it’s unclear exactly how to measure changes in their aggregate ‘quality.’ Indeed, how might we reasonably measure such an abstract quantity, especially considering that different individuals have different use-cases? The natural answer is simply through the system of market prices in capitalism, where price discovery naturally aggregates together all of the relevant information into a single metric! This is exactly the inspiration behind the method of hedonic adjustments, developed by Griliches (1988), who stated that “one might use regression techniques to relate the prices of different models or versions of a commodity to differences in their characteristics, and discover thereby the relative valuation of such qualities is reasonably obvious.”
Again, moving to a simpler analogy illustrates the flaws in Fitzsimmons’s argument. Suppose that you wish to purchase a used car today; you have an innumerable number of different options, models, colors, etc. available to you. Typically, however, a more expensive used car will generally be higher quality than a cheaper one, and the fact that cars are highly complex products that include thousands of different, individual characteristics does not appear to meaningfully stop the market from reflecting this notion of overall quality in its pricing. We do not see the natural emergence of a “one car for one car” barter economy; similarly, “one CPU is one CPU” is not even in the set of remotely plausible quality adjustment methods.
The extent of ignorance on display in this section is truly remarkable. From Fitzsimmons:
We could imagine other methods: comparing how many pixels on a monitor the CPU can drive, or even putting gamers’ heads in a scanner and comparing happiness playing a classic video game like Quake versus the latest Overwatch. How do you adjust for the fact that an average person can now listen to infinite amounts of music for free or almost-free with a cheap smartphone, compared to the millions of dollars in CD, cassette tape, and vinyl costs that would have required thirty years ago? Is it even worth trying to “adjust” for that?
The point is not that any of these methods is right or wrong. The point is that if you have a half-dozen plausible ways of adjusting for quality, none of which from first principles is more objective than another, and you rule out one method for giving ludicrously low results, and one method for ludicrously high results, and just choose a middle route that feels reasonable, then the result of this adjustment is not an objective measure of output. All you have done is launder vibes into something that has the appearance of an objective number.
I could also imagine quality adjustment methods where we count the number of socks in my drawer each night or where we experiment with Roman augury, but the relevance of my imagination is not clear when the BLS clearly does not perform quality adjustments for most goods and has a clearly defined set of standard, generalizable methods used when such adjustments are performed. This is not to say that cost based or hedonic methods are infallible; however, they are well-documented and standardized, and hundreds upon hundreds of pages have been written describing their strengths and pitfalls, comparing their values to theoretical bounds, exploring sensitivity to usage of different deflators, etc., such as in the OECD Handbook on Hedonic Index Quality Adjustments in Price Indexes. Instead of engaging with this work, however, Fitzsimmons prefers to make vague arguments about how these methods are equivalent to “laundering vibes.”
Ultimately, Fitzsimmons’s argument here essentially condenses to:
- Nobody understands how quality adjustments are performed.
- There are no natural methods for measuring quality improvements.
- Because there are no natural methods for quality adjustments, we can invent all types of absurd methods, and once all of these absurd, contrived methods are included in the set of potential adjustment methods, we see that the range of possible outputs is extraordinarily high.
The first and second statements are untrue; the third statement is simply ridiculous.
Changes in market structure or product design should induce changes in adjustment methodology
The final argument made in this section has to do with ‘bespoke’ changes in the methodology used to perform quality adjustments for particular items. Fitzsimmons gives the example of microprocessors switching from cost based (price overlap) adjustments to hedonic adjustments:
What the BLS actually did in calculating the CPU price index was the price overlap method. But then, in 2010, the improvement in the price index slowed down, as new CPUs were no longer commanding a premium, perhaps because they were burning more heat and energy at a time when people were more energy conscious. Rather than say “well, CPUs are not actually getting better, they just have new trade-offs,” the BLS changed their methodology to a custom “hedonic” method that measures all the attributes of the processor.
Again, it is not that the hedonic method is worse, the problem is that if you are changing the methodology after-the-fact because the numbers look wrong, you do not have an objective number, you are converting subjective intuition into something with the appearance of objectivity. The data is no longer telling us how the economy is doing, but instead the consensus feeling of the statistical agencies on how technology has changed is now driving the data.
What is remarkable about this argument is that Fitzsimmons has taken the effort to learn about a very specific and technical event, namely, the change to hedonic adjustments for microprocessors, and then completely misrepresented the motivations and the outcomes of this change in a way that almost suggests willful deception.
The paper which initiated this change was Byrne et al. (2018), How Fast are Semiconductor Prices Falling? and, for simplicity, I will quote directly from its first two pages:
How fast are semiconductor prices falling? Data from the Producer Price Index (PPI) published by the U.S. Bureau of Labor Statistics indicate that prices of microprocessor units (MPUs) have barely been falling in recent years. This very slow rate of price decline stands in sharp contrast to the rapid declines in MPU prices reported from the mid-1980s up to the early 2000s and the exceptionally rapid declines in the latter half of the 1990s. If accurate, the apparent slowdown in MPU price declines in recent years would be troubling, given the long-run relationship between rates of price decline of semiconductors and the pace of innovation in that sector, which has served as an engine of growth throughout the economy.
The apparent slowdown in the rate of price decline is puzzling given evidence that the performance of MPUs continued to improve at a rapid pace after the mid-2000s. The key to resolving the puzzle may reside in another industry development. Over the course of the 2000s, the properties of the MPU prices posted by Intel, the dominant producer, changed dramatically. In the early part of the decade, Intel almost always lowered the posted prices of existing chips as they aged and as new, higher-performance models were introduced. However, by the mid- 2000s, the posted prices had become much stickier over the chip’s life cycle. […]
The reason for this change in the life-cycle pattern of posted prices is a matter of speculation. It is possible that Intel actually changed its life-cycle pricing strategy to extract more revenue from older models, with the posted prices reflecting this change. Alternatively, Intel may not have changed its pricing strategy at all, but simply began to post prices that had less connection to transaction prices. Neither we nor anyone else outside Intel has the information to distinguish between these two alternatives, as Intel does not release chip-level transaction prices. Given this lack of information, the challenge is to construct price indices that are robust to potential measurement issues with the available price data.
We argue that the matched-model methodology used by BLS fails this challenge after the early 2000s. In an environment with flat price profiles as models age and with increasing quality over time, matched-model price indexes for MPUs such as the PPI will understate the amount of price decline. We make the case that hedonic indexes are better suited to capturing price trends in this situation and develop new hedonic indexes for quality-adjusted prices using data for Intel MPUs from 2000 to 2013. We also argue that hedonic indexes for MPUs should utilize measures of end-user performance rather than technical variables capturing physical characteristics (such as feature size) and engineering specifications (such as clock speed). Performance measures provide a superior control for quality change when constructing price indexes for MPUs because they gauge the actual output obtained by a user rather than the input characteristics used to produce that output. Moreover, with rapid changes in MPU architecture, identifying the correct set of technical characteristics (and likely changes in that set) can be challenging.
We immediately see that Fitzsimmons’s characterization of the driving impetus behind this change is completely incorrect. He claims that “the improvement in the price index slowed down, as new CPUs were no longer commanding a premium,” but Byrne et al. writes that after 2010, Intel essentially stopped lowering prices of old chips even as they reduced new ones — which is significantly different from the claim that new chips were being released at lower premiums relative to older models! It is certainly possible in principle that the rate of CPU improvement slowed down, but as Byrne et al. comment, there are many other plausible hypotheses, such as Intel changing its pricing behavior to a more profitable pattern. In light of this uncertainty, it seems entirely reasonable to choose, or at least explore, a more general quality adjustment method which might be able to distinguish between these subtle nuances.
Additionally, Fitzsimmons proposes, as an explanation for this pricing behavior, that perhaps “CPUs [were] not actually getting better, they just have new trade-offs.” This is a curious objection given that a hedonic model based on product characteristics should actually more accurately capture the preferences of end users; indeed, Byrne et al. note that “hedonic indexes for MPUs should utilize measures of end-user performance rather than technical variables capturing physical characteristics (such as feature size) and engineering specifications (such as clock speed).”
Finally, Fitzsimmons accuses the researchers of “changing the methodology after-the-fact because the numbers look wrong.” What, exactly, is the alternative here? When BLS researchers notice unusual trends in PPI data, should they uncuriously ignore such trends and keep on mechanically calculating quality adjustments even as the outputs seem to become increasingly divergent from reality? Presumably not. Byrne et al. is a 57-page paper with copious subanalyses and statistical tests; has Fitzsimmons engaged with this work in any substantive manner? No; instead he would rather accuse the researchers of massaging the data to fit their preconceived intuitions.
Vague non-arguments about sectoral decline
The final section of Fitzsimmons’s article, “American Decline Sector After Sector,” is a whirlwind tour of grim anecdotes: CPUs, LCDs, autos, solar, batteries, drones, ships, Boeing, machine tools, and pharma. The first problem here isn’t even that each sentence is false; it’s that the list freely mixes quantities (units/tons), nominal trade balances, and index numbers, swaps between global capacity shares and domestic value added, and attempts to overwhelm the reader with a barrage of negative mood affiliation without making any attempt at formulating a precise argument.
For example, take the first paragraph of this section:
In computers and semiconductors, the best thing we can say for U.S. performance is that we make almost twice as many CPUs as we did in 1997, and they are 1,000 times faster. But the gloomier take is that we lost the top position to Taiwan. American fabs now only make 12% of chips worldwide, down from 37% in 1990. All other computer components are even worse. The U.S. does not make LCD panels, circuit boards, motherboards, or hard-drives. America now annually imports $400 billion in electronics, compared to exports of $200 billion.
It’s genuinely unclear what Fitzsimmons is arguing for here. He first acknowledges that CPU production and quality have clearly increased since 1997, but then complains that Taiwan produces more than the U.S. Why should the U.S. necessarily make the highest numerical quantity of semiconductors when compared to all other countries? He seems upset that American fabs only produce 12% of chips worldwide — but what is the right proportion for American fabs to be making? As industries develop and globalize, it’s natural for domestic manufacturing to wax and wane; is Fitzsimmons’s position essentially that in an ideal world, the percent of worldwide output manufactured within America in any given product category should only increase over time? If so, this position is simply incompatible with the notion of international trade. After all, imagine if every country had the same expectation — it is numerically impossible for one country’s share of worldwide output to increase without decreasing at least another country’s share of worldwide output.
In another masterclass of vague implications, Fitzsimmons then brings up the case of real value-added output in automobiles:
In automobiles, the raw number of vehicles manufactured in the U.S. has stagnated since the 1980s, and declined 39% per-capita since 1987. However, the vehicles produced are heftier, safer, faster, cleaner, and loaded with features. What this means for overall “output” is dependent on your point of view and what question you are trying to answer.
Again, what is the argument here, exactly? If you prefer to examine the number of cars manufactured in America rather than value-adjusted output, you are free to do so — it just so happens that most people seem to agree that improvements in automobile quality, durability, etc. since 1980 are fairly meaningful, so it makes more sense to look at gross output! It’s particularly ironic that Fitzsimmons would take issue with the “stagnation” in the number of raw vehicles produced given that in an earlier section he points out that increased vehicle longevity would be a natural component of product quality.
The point of an aggregate index is that it sums together different components
The astute reader might notice that Fitzsimmons has moved from general criticisms of particular computational methods used to estimate manufacturing GDP to a laundry list of sector-specific declines across a variety of different metrics. There are two obvious objections to his argumentation:
- The entire point of computing aggregate statistics is to smooth over sectoral variation, so pointing out that some sectors have apparently declined does not imply any necessary contradiction with the aggregate index improving over time.
- A principled analysis of sectoral variation over time would apply the same metric over the same timescale to the same statistic across a set of standardized sectors, rather than simply pulling out a grab-bag of random, tangentially related statistics.
Again, the difficulty with criticizing Fitzsimmons’s argument is that there is simply no coherent argument being made in the first place:
- He claims that the “lone bright spot is medical equipment and supplies, which is up 45%,” then immediately contradicts himself by saying that “production of rockets and space-lift capacity” is self-evidently better than it was 25 years ago.
- In some parts, Fitzsimmons seems to at least recognize that not all supply chains are of equal importance to national security, e.g. where he discusses manufacturing of “essential medicines.” Yet in the next breath he eagerly discards this notion, acting as though a -71% decline in domestic textiles output or a -54% decline in domestic production of printed books “[paints] a grim picture” (for whom? in what sense?) — essentially an implicit motte-and-bailey argument. Upon further consideration, however, it’s just not terribly clear why having Vietnamese laborers produce my Uniqlo T-shirts is some sort of national catastrophe.
- Amusingly, Fitzsimmons continues to inveigh against the validity of gross output measures all while using them to support his claims. He writes that “real gross output numbers can mislead if vertical integration reduces double-counting,” almost as if we might prefer to separate out the value added by the manufacturing process from the starting value of the inputs used — a concept which Fitzsimmons earlier decried as nothing more than “A Fictitious Measure of Output With No Meaning!”
- The particular statistics Fitzsimmons chooses vary wildly from sector to sector, and in many cases simply appear to be straightforwardly uninformative. He claims, for example, that machine tool shipments have “[crashed] from 75% of domestic use in 1980 to 35% in 2014,” without realizing that this measure has no necessary connection to trade competitiveness, global sales, or productive capacity. And one might productively ask — why does he stop the comparison in 2014? Why does his comparison of solar panel market share begin in 2008? Why is there zero attempt to apply any sort of basic systematization to his process of inquiry?
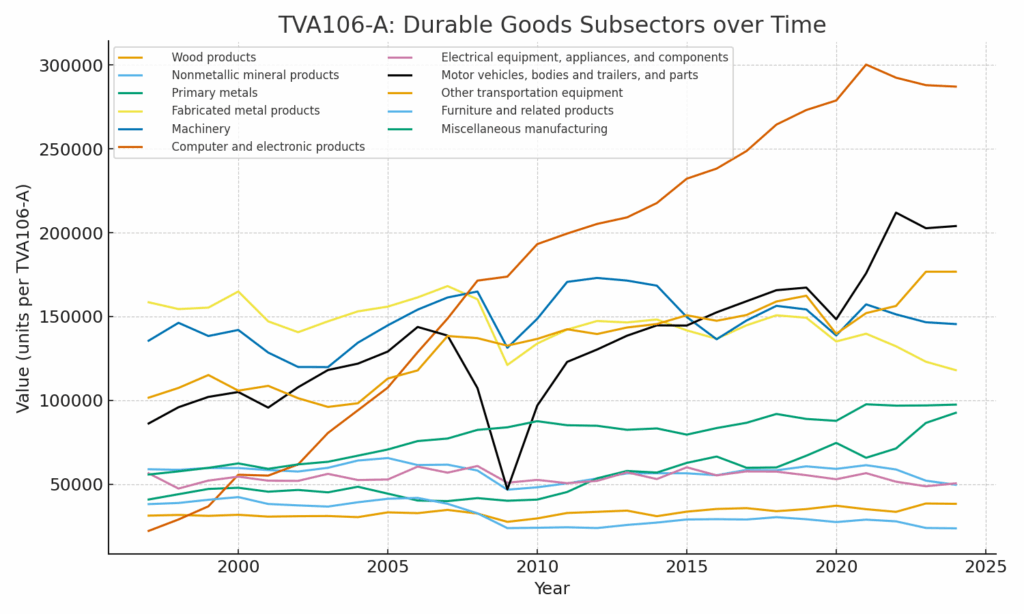
I suspect that Fitzsimmons takes this approach largely because if he were to perform a systematic analysis, it would not in fact support the claims that he is attempting to make. For example, let’s take the Value Added by Industry spreadsheet from the BEA’s Interactive Data Tables; subsheet TVA106-A gives data for Real Value Added by Industry from 1997 to 2024, given in millions of 2017 chain dollars. Manufacturing is decomposed as the sum of durable and nondurable manufacturing, which are themselves broken down into more detailed subcategories. If we plot the corresponding time series, we obtain the following graph for durable manufacturing subsectors:
Similarly, we obtain the following graph for nondurable manufacturing subsectors:
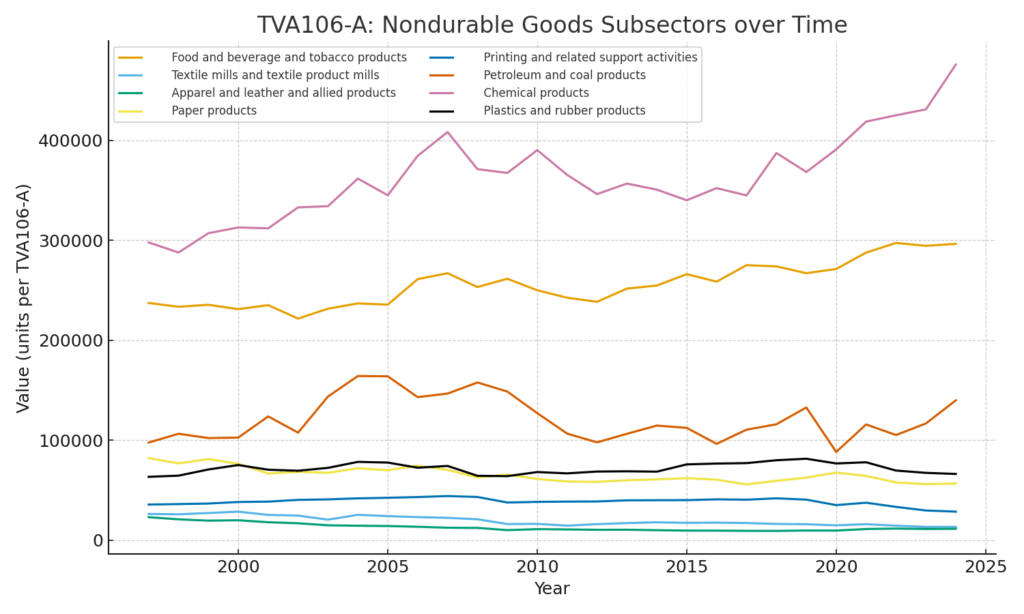
Hardly an image of stagnation and decline!
To be clear, I am not claiming that American manufacturing could not, or should not, be improved. Fitzsimmons is the one making the claims here, and moreover asserting confidently that economic orthodoxy is wrong, yet he seems to have not even made the most basic of attempts to perform an unbiased analysis of the available data, instead resorting to a grab-bag of rhetorical tricks.
Fitzsimmons simply doesn’t seem to believe in international trade
Aside from his examination of sectoral declines, Fitzsimmons also takes issue with importing pharmaceuticals, evidently in both packaged and unprocessed forms:
In pharmaceuticals, it is very difficult to find raw numbers in terms of “doses manufactured of essential medicines.” But in dollar terms, the U.S. has transitioned from being a slight net-exporter of pharmaceuticals in the mid-1990s, to a significant net importer, now importing $90 billion while exporting $54 billion. Additionally, the U.S. only manufactures 53% of the active pharmaceutical ingredients that are used in domestic production of medicine.
I admit that this may simply be a matter of taste, but supposing that I wanted to ensure the U.S. had an adequate stock of “essential medicines” on hand in case of national catastrophe, I would enumerate a list of those supplies and allocate enough money to keep them in stock — perhaps something like, say, the U.S. Strategic National Stockpile. Essential medicines are generally quite inexpensive and my understanding we could broaden the scope of the SNS considerably for a relatively low cost. However, what Fitzsimmons is implicitly suggesting is that instead of just taxing enough to fund such a stockpile, we should instead introduce massive pricing and logistical distortions into the entire pharmaceutical supply chain to prepare for some hypothetical future scenario where global trade breaks down. I do not personally find this proposition enticing.
At the very end, Fitzsimmons reiterates the main thesis of his article:
Putting it all together, U.S. manufacturing is hurting badly. It is decidedly not the case that American manufacturing is more productive than ever.
But why is it true that American manufacturing is not more productive than ever? Throughout this entire piece, Fitzsimmons claims that productivity statistics are inaccurate — but he has failed to actually demonstrate this claim. I do not believe anyone would deny that in a better and more productive world, total outputs of certain domestic industries could be higher; however, the existence of a hypothetical better world does not mean that American manufacturing is somehow diseased in unique ways not represented in national statistics, nor does it mean that an amalgamation of circular argumentation and empirical misrepresentations holds any legible meaning.
In closing, Fitzsimmons appears to believe that the U.S. should simply manufacture everything and import nothing:
It is an inexcusable failing that the U.S. does not have comprehensive numbers that track all essential output needed to maintain our quality of life, including not just the number of cars or microchips or refrigerators, but the percent of the components actually made in the USA, and the percent of the machine tools needed to build the components made in the USA. Until we have those numbers and they start going in the right direction, we need less boosterism and more grim resolve to reindustrialize.
What, exactly, does it mean to “maintain our quality of life?” Will government officials be regularly checking to ensure that we can produce 2000-quality fridges, but anything past 2000 is fair game for international trade? What about the economic and job losses resulting from inefficient onshoring — are employment and wages not themselves components of “quality of life?” It is not that there is no value in strategically on-shoring industries critical to our national security; however, life in the modern world is sufficiently complex and interdependent that almost every manufacturing chain can in some sense be framed as an important part of our current “quality of life.”
At the very least, Fitzsimmons should take comfort in knowing that no less a mind than Kim Il Sung himself promulgated the same ideas half a century ago. Indeed, in On the Juche Idea, Kim writes:
The economy is the material basis of social life. Economic self-sufficiency enables one to consolidate the independence of one’s country and live independently, provides a sure guarantee for Juche in ideology, independence in politics, and self-reliance in defence and ensures rich material and cultural lives for the people.
In order to implement the principle of economic self-sufficiency, one must build an independent national economy.
Building an independent national economy means building an economy which is free from dependence on others and which stands on its own feet, an economy which serves one’s own people and develops on the strength of the resources of one’s own country and by the efforts of one’s own people.
Concluding remarks
I wish I had never read this Palladium article so that I would not have been burdened with the duty of correcting it. Where Fitzsimmons makes concrete arguments, the details are mistaken and the data are unsupportive; where Fitzsimmons argues in the abstract, the positions do not even remain self-consistent throughout the course of the article.
In the end, it’s not really clear what Fitzsimmons does believe in, because he doesn’t seem to genuinely think that complex economic statistics are even computable in principle, and his position on manufacturing statistics appears to boil down to “all the numbers should be going up, and none of the numbers should go down.”
Leave a Reply